
From 51 FlexLM CSVs to conversational license analytics
A chip simulation waits when FlexLM denies a license checkout. The software licenses behind one simulation can cost six figures, and a project runs thousands of simulations. Too few seats stop engineers; too many leave expensive capacity idle.
Bazinga Labs builds design-automation software for teams managing that tradeoff. FlexLM already records every checkout and denial (feature, user, host, timestamp, granted or refused), but turning those events into a capacity decision still required manual analysis.
One question meant a week of exports
The working set began as 51 CSV exports on NFS and S3, across 9 test runs and teams of up to 650 engineers. Answering a license question meant exporting, joining, and reading the result in a spreadsheet, typically about a week of work.
The questions were concrete:
- Which features denied the most checkouts, and in which week?
- What was peak concurrent usage for each feature?
- Who held a license without using it?
- Which licenses were under-subscribed, over-subscribed, or in range?
Fifty-one exports became one queryable dataset
Bazinga consolidated tens of millions of rows into four queryable datasets: license events, a utilization series, and feature and denial dimensions.
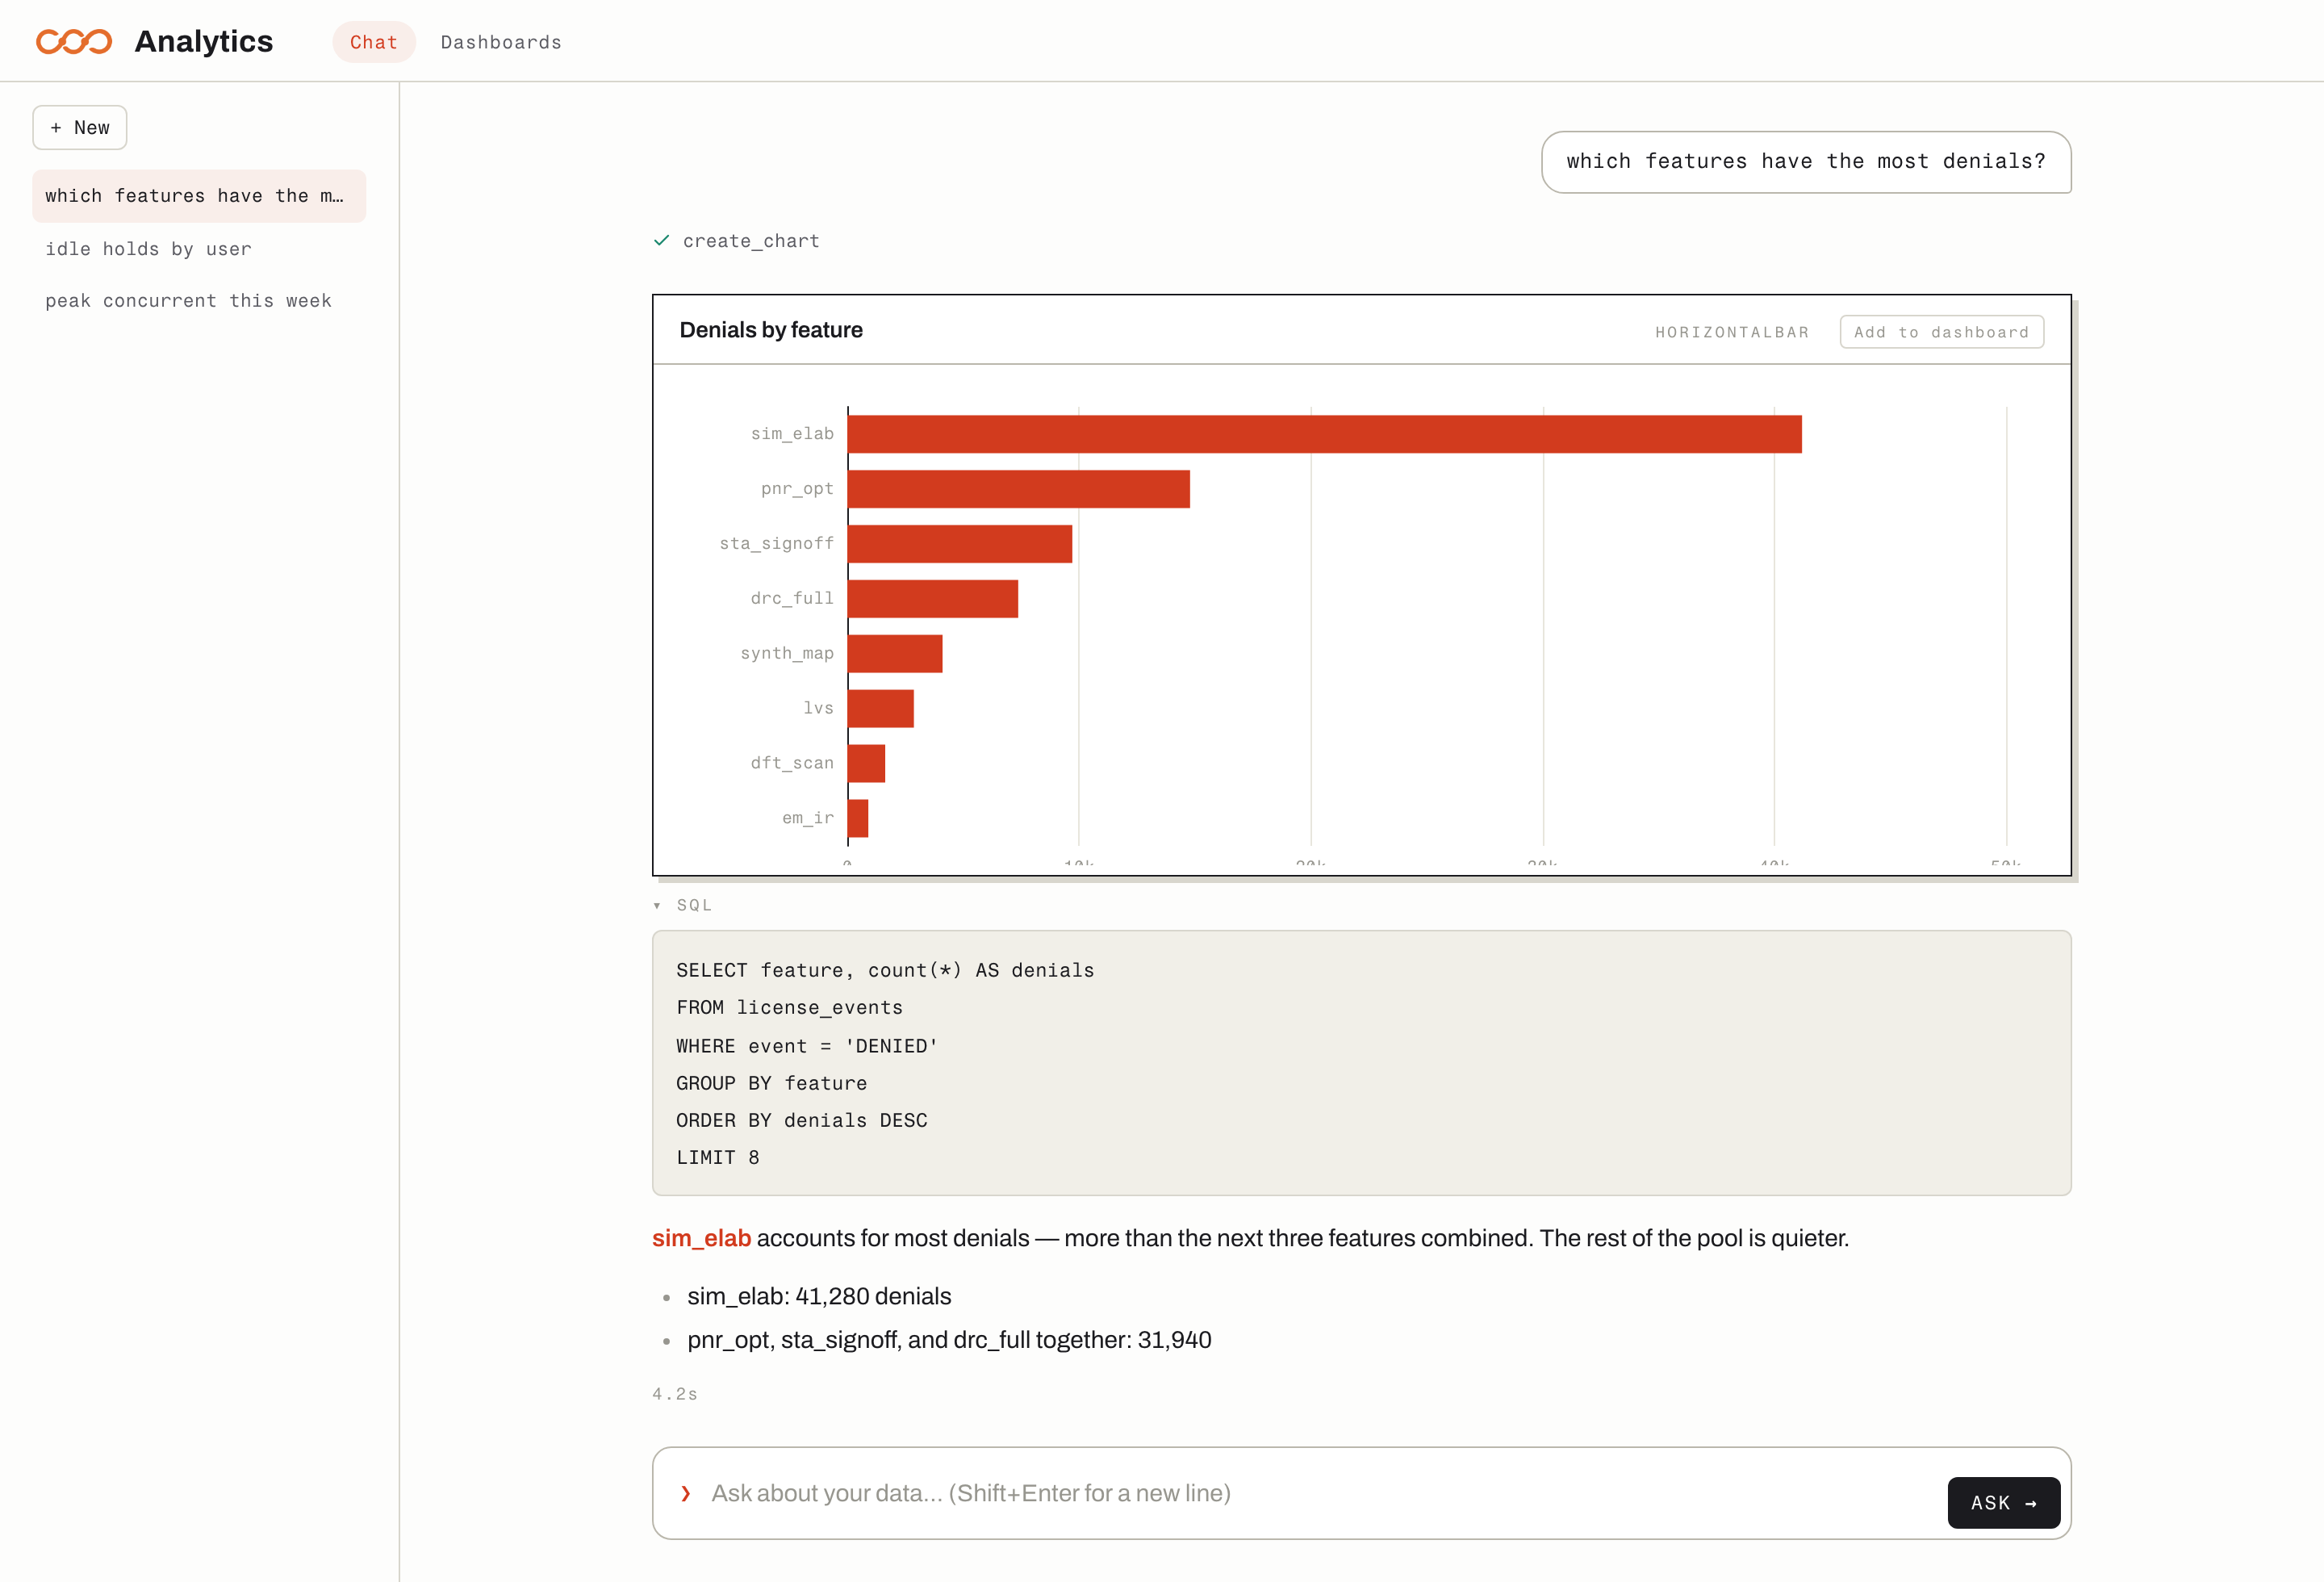
Once the events were a table, denial counts by feature and week were one aggregation:
SELECT   feature, date_trunc('week', ts) AS week,
         count(*) AS denials
FROM     license_events
WHERE    event = 'DENIED'
GROUP BY feature, week
ORDER BY denials DESC LIMIT 15;
A question produces inspectable SQL
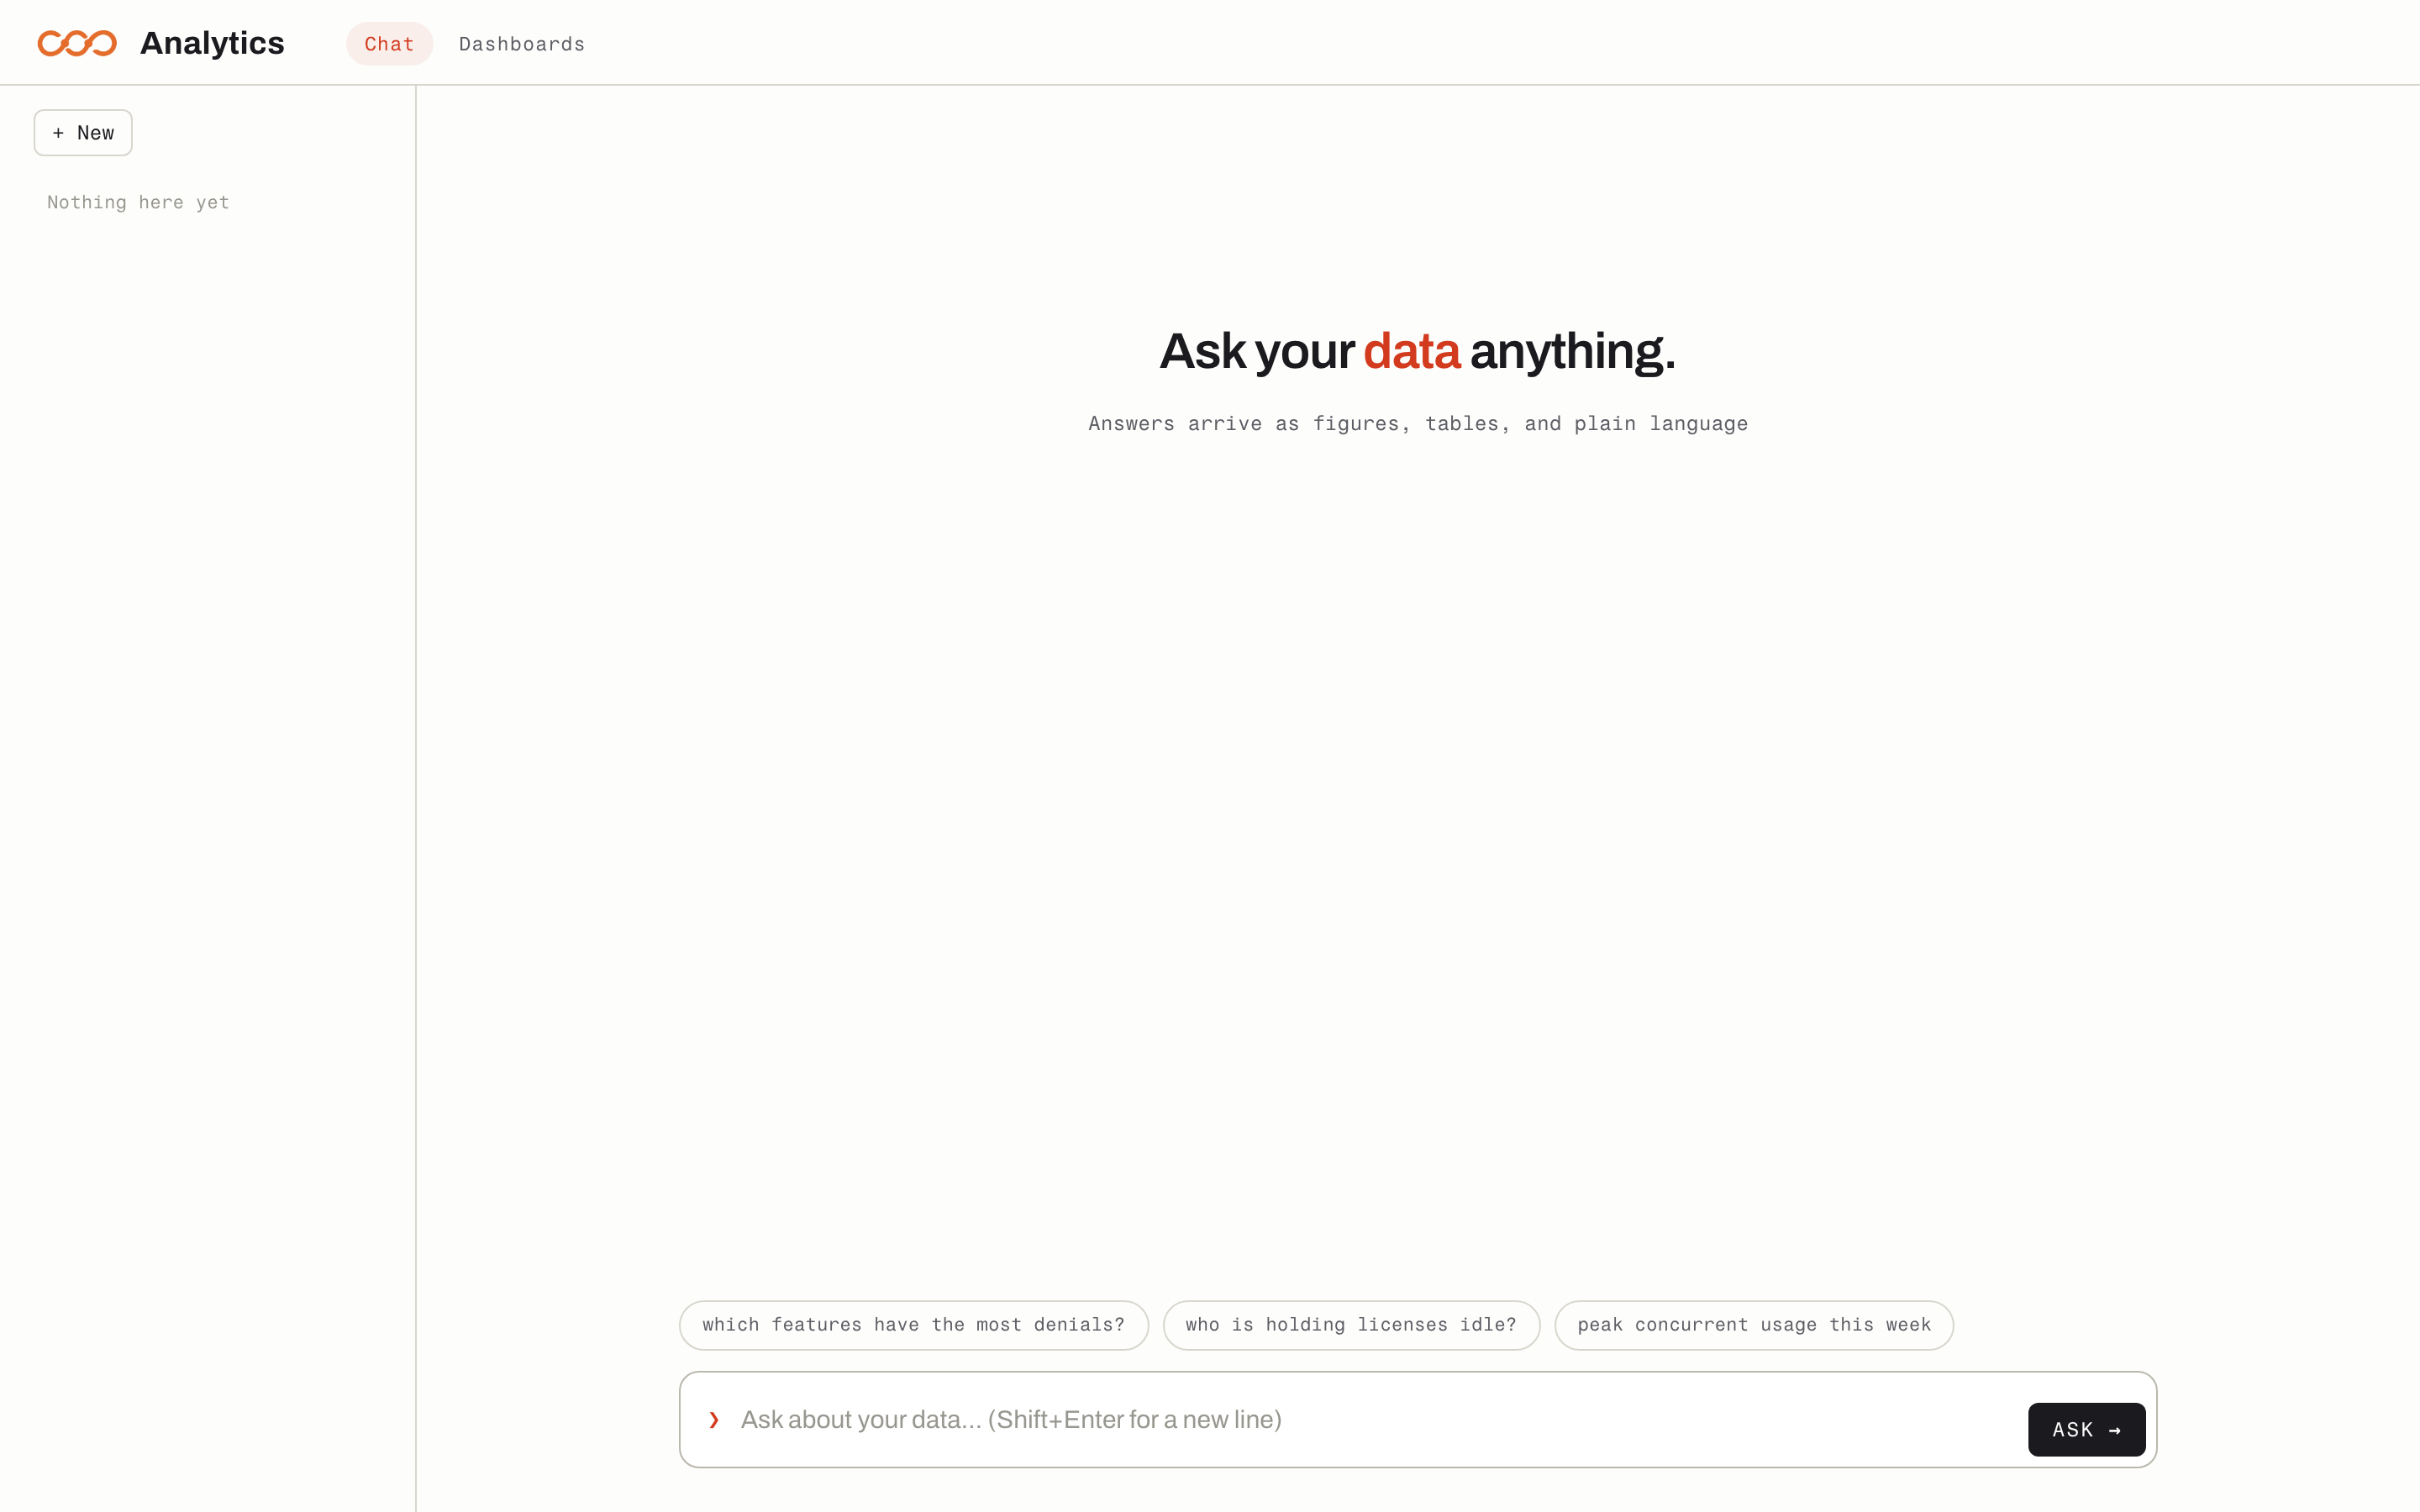
Bazinga put a conversational layer in front of the tables. A Bazinga customer asks a license question in English; the layer writes SQL, runs it against Infino, and returns a chart with the query one click away. The saved SQL makes every answer inspectable.
For “Which features have the most denials?”, the result is the aggregation above, a horizontal bar, and a short summary:
Dashboards
A customer can pin the resulting chart beside under-subscribed licenses, over-subscribed licenses, idle holds, and quarterly peak usage. On the next load, the dashboard executes the saved query and chart specification against the current data.
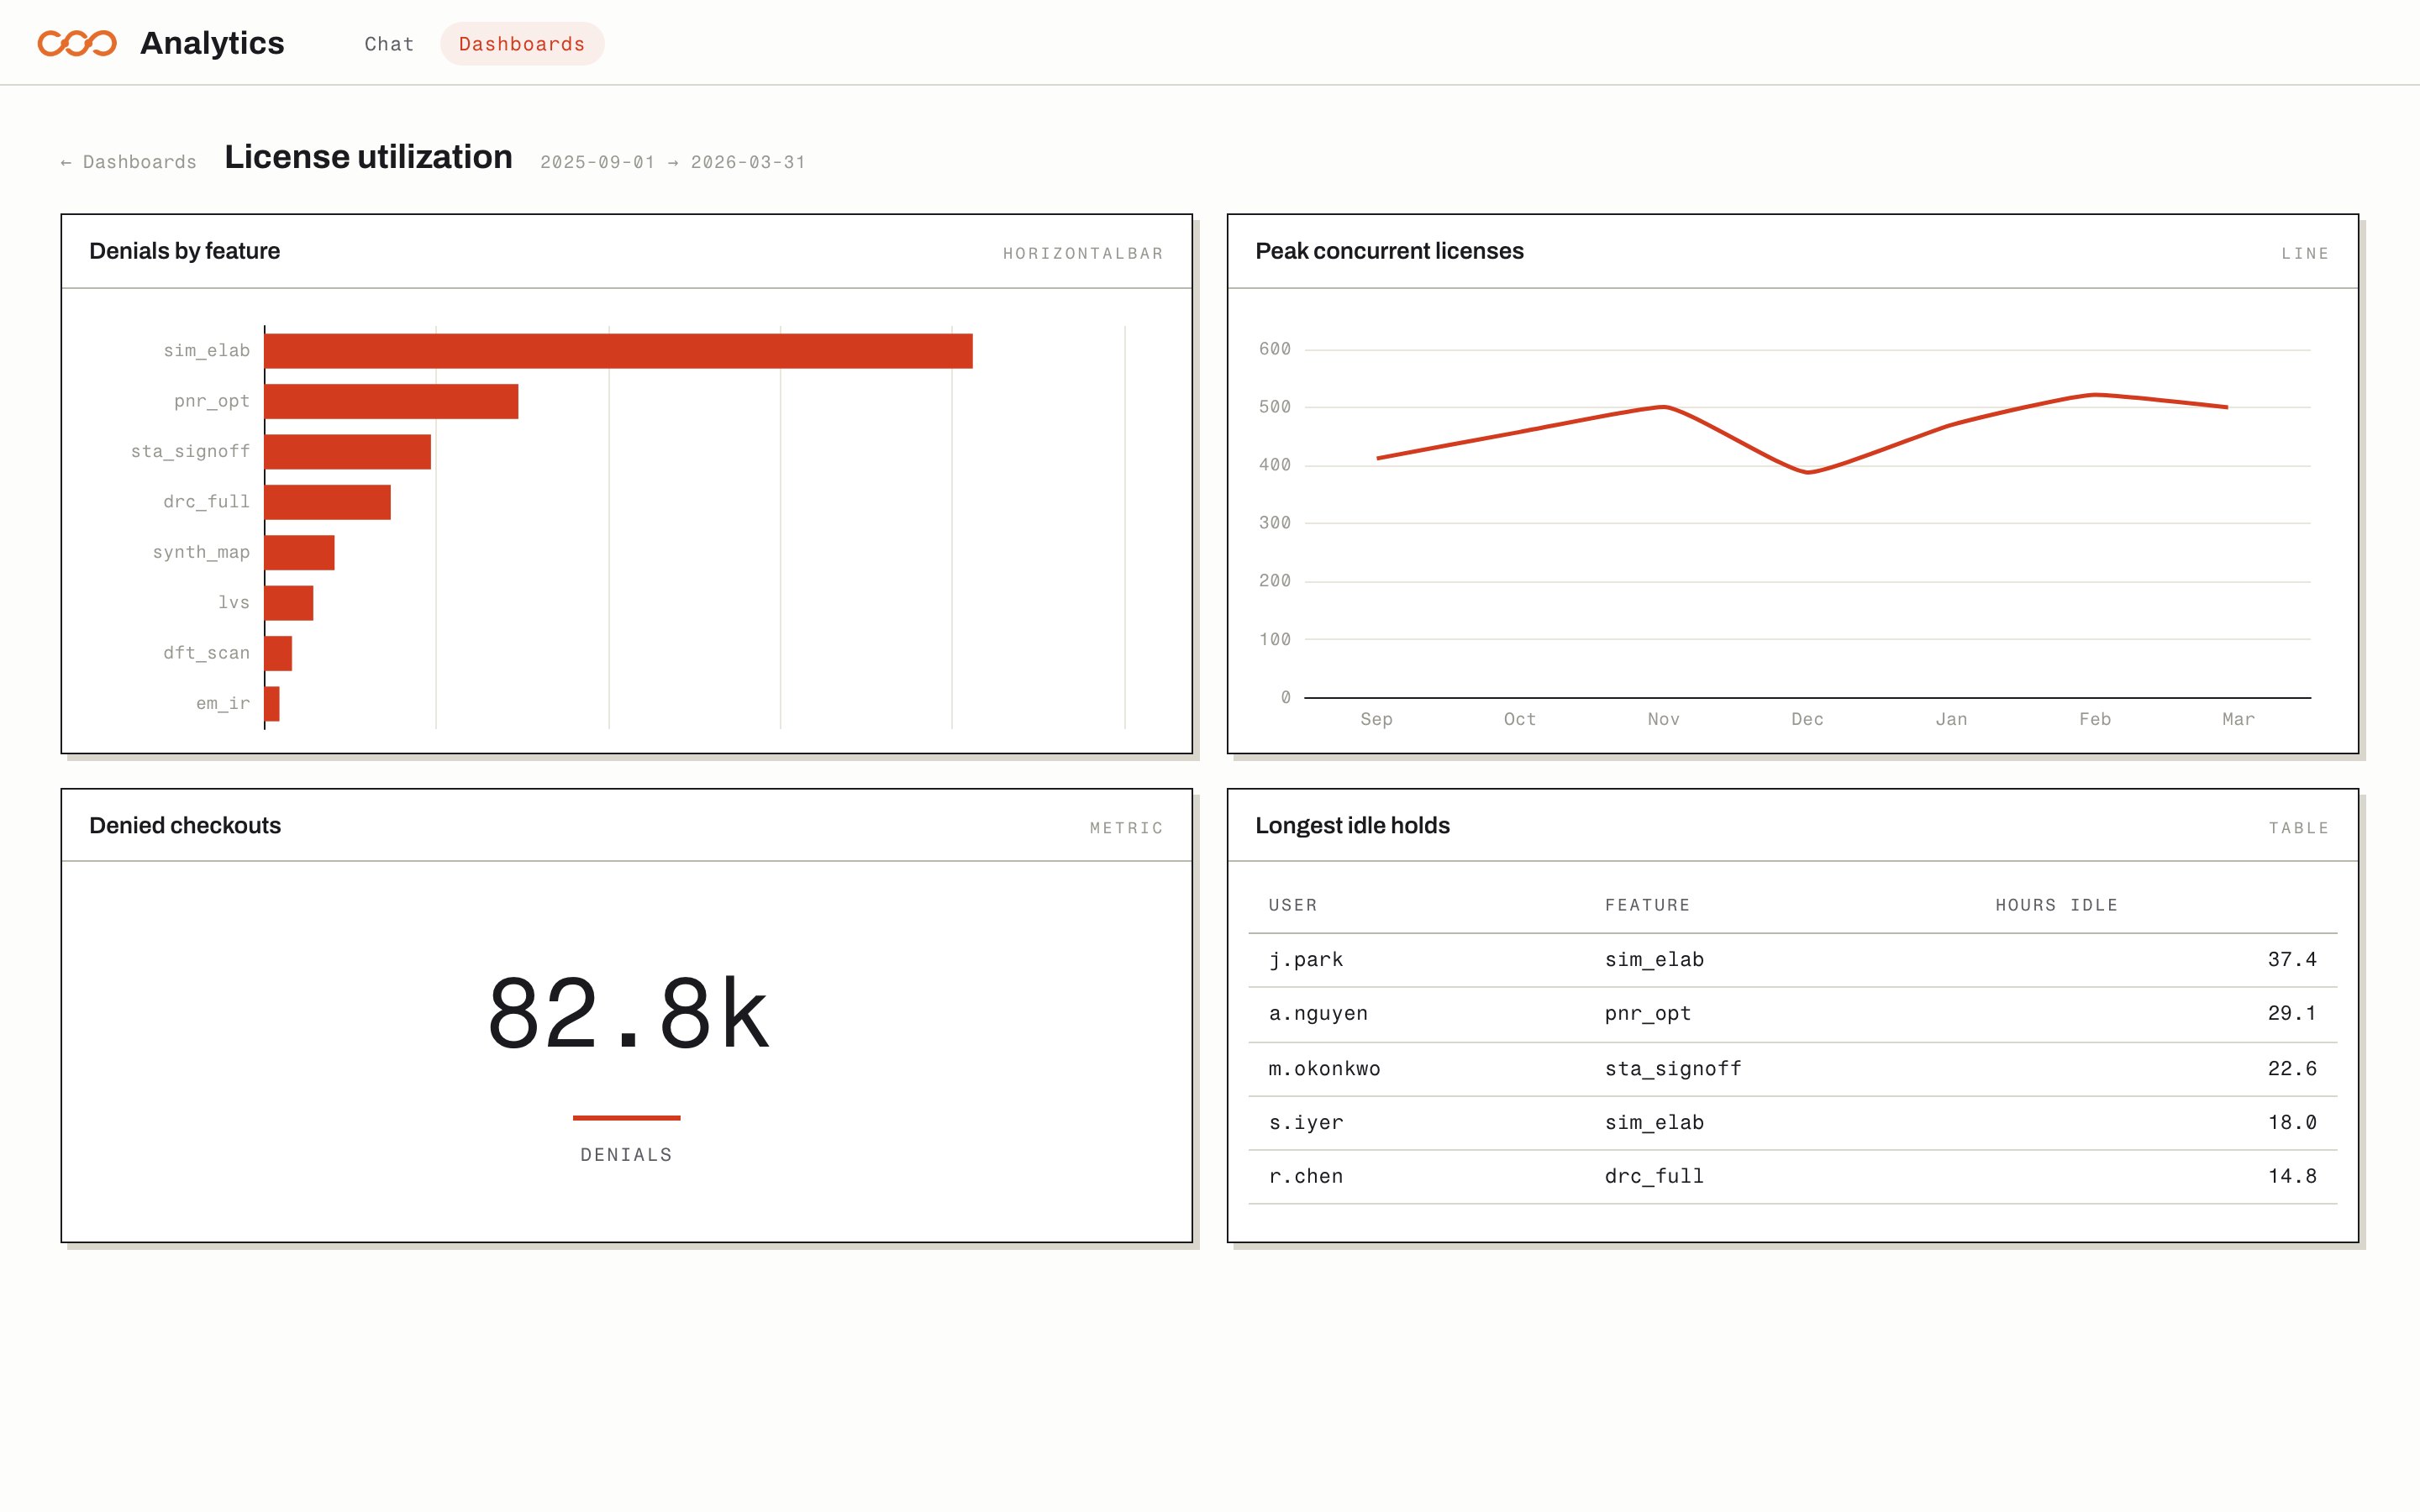
The model authors the dashboard; the application serves it
The conversational model translates a question into SQL and produces the chart object. After pinning, the application reruns the saved SQL and chart specification directly against Infino on each dashboard load.