
Infino: fastest VectorDB at a million, still cheaper at a billion
Every team that adopts vector search eventually hits the same fork. The index that gives you millisecond lookups wants everything in RAM; the moment your corpus outgrows one machine, you're pushed toward a different class of system — distributed, disk- or object-backed, built for size and priced in latency. So you end up running two: a fast store for the data you query hot, a big store for the long tail, and a synchronization problem in the middle that nobody asked for.
We don't think that fork is fundamental. It's an artifact of building the fast thing and the big thing as different systems. Infino is one engine that spans the whole range — and reshapes itself along the way: a graph in memory when the data is hot and small, the same data served from an object-storage index when it's vast and cold.
To make that concrete, this post starts at the fast end — where, today, Infino is the quickest engine on the standard benchmark — and walks out to the end where it serves billions of vectors off object storage. One engine the whole way.
The benchmark
VectorDBBench is the standard, public benchmark for vector search: fixed datasets, fixed recall targets, an engine-agnostic harness. On its Cohere-768 workload at 1M vectors, an Infino query returns in about 0.9 ms at the low end of the recall curve and 2.6 ms at 0.99 recall. On the same hardware, that is faster than every other engine we measured, at every recall point we compared.
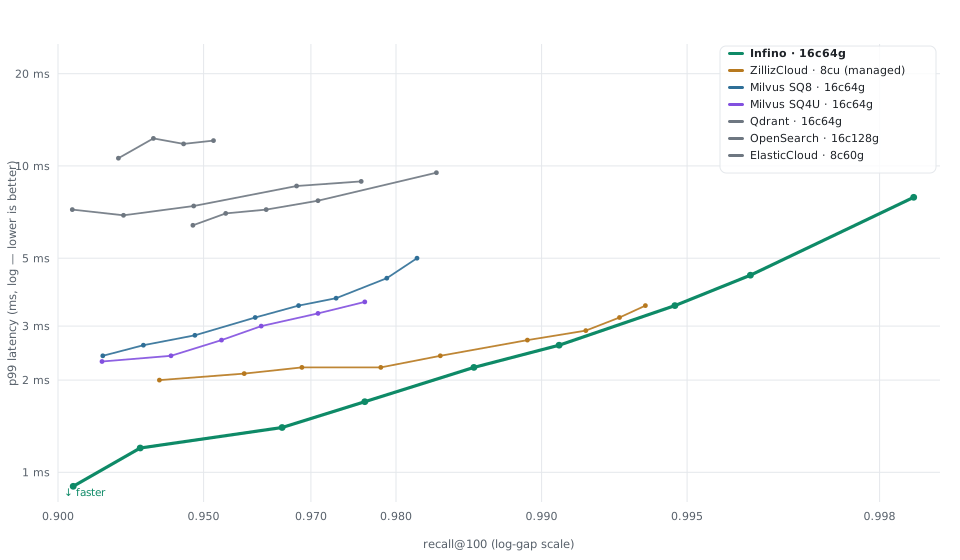
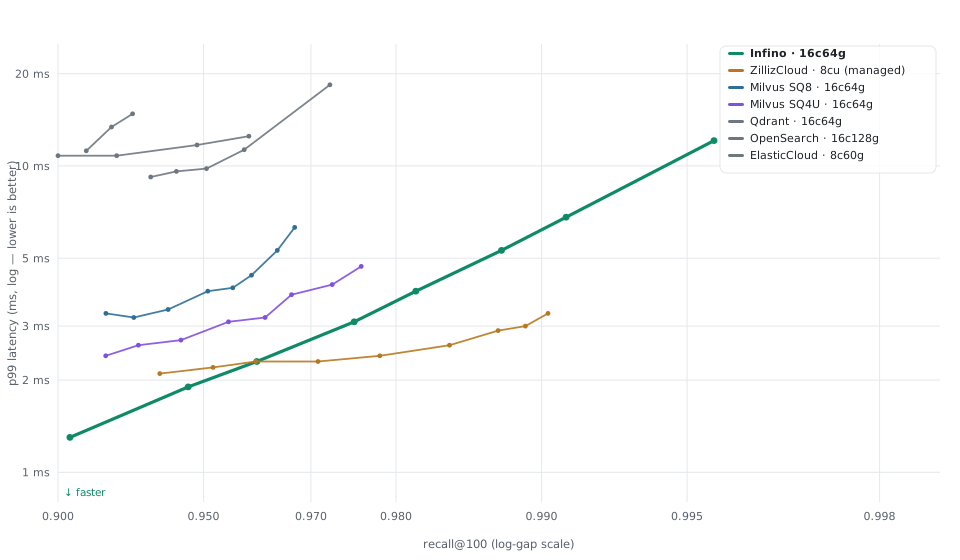
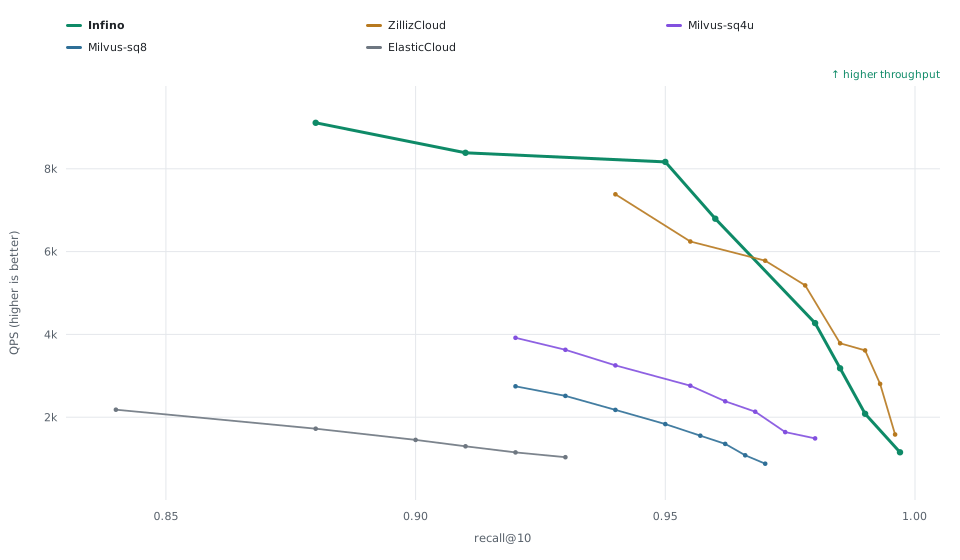
standard_20260403 results. Drawn from our fork of the VectorDBBench leaderboard (results, QPS-recall) — the benchmark charts throughput at recall, so these latency curves come from the same per-ef result files.At 1M, Infino is the lowest-latency engine at every recall point we compared. At 10M it stays ahead of the comparable SQ8 build and the lower-bit SQ4 alternative across the curve — the one exception is a hosted cloud service at the highest recall, currently.
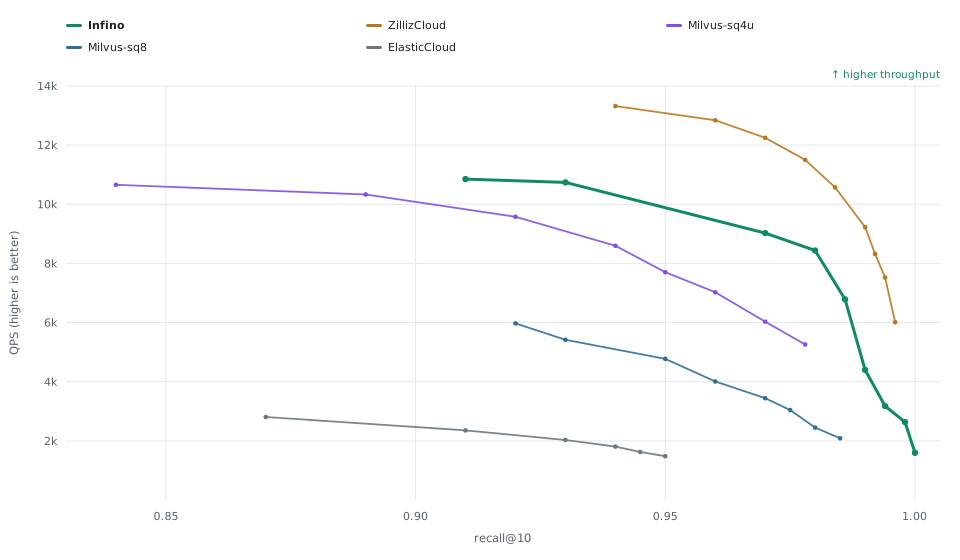
Latency is only half the picture; the benchmark's native view is throughput. At 10M Infino leads across most of the curve; at 1M a hosted cloud posts higher QPS through the upper-recall range. Throughput and latency answer different questions — and for a query sitting in a request path, latency is usually the one that bites.
The turn: one engine, many shapes
That speed has a cost, and the cost is memory. A graph index like HNSW keeps your vectors — and the graph over them — resident in RAM: a few gigabytes at a million vectors, a large machine at a hundred million, a fleet at a billion, most of it kept warm for data that is almost never queried. You pay to keep everything hot, whether or not it is.
The usual response to that bill is a second system: move the cold data to something object-backed, keep the hot data in the fast index, and maintain the boundary yourself forever. Infino's response is that these are not two systems. They're shapes of the same engine — a graph (HNSW) over quantized vectors in memory when the working set is hot, and an object-storage index when it's vast. The durable copy always lives in object storage (Parquet superfiles); what shifts as the corpus grows is only how much is served from RAM. Same data, same query API, same engine binary.
The engine changes between those shapes on its own — but they aren't the whole set. If you're at small scale and can trade a little recall for the cheapest possible scan, there's a flat 4-bit scoring path you can opt into: no graph, no partitions, just the codes. We benchmarked exactly that shape against faiss and turbovec in an earlier post. It's a choice you make rather than one the engine makes for you today — and more shapes are in the works, so the engine may well change its avatar again as the corpus grows.
The self-driving engine does more than tune its parameters to your data: it reshapes its own structure too — graph when hot, object-storage index when vast — and hides the seam.
How a query runs from the resident graph
A resident query in Infino is a two-stage walk:
- Navigate narrow. The graph is walked over 8-bit quantized vectors (SQ8). Int8 distance kernels are cheap and cache-friendly, so the traversal — the part that touches the most nodes — runs on the smallest representation that still steers correctly. This gets you to the right neighbourhood fast.
- Rank wide. Only the shortlist that survives the walk gets re-scored on a higher-fidelity representation (Sq16). You pay the more expensive distance only on the handful of candidates that matter, not on every node you visited.
Navigate on the cheap code, rank on the good code. The walk is where the time goes, so it runs on the representation that makes each step cheapest; the ranking is where accuracy is decided, so it runs on the one that makes each comparison truest.
Where the milliseconds are spent
Break a resident 1M query into its parts:
| operating point | recall | walk | re-rank | engine | benchmark p99 |
|---|---|---|---|---|---|
| shallow | ~0.91 | ~0.59 ms | ~0.04 ms | ~0.64 ms | ~0.9 ms |
| deep | ~0.99 | ~1.95 ms | ~0.10 ms | ~2.05 ms | ~2.6 ms |
Almost all of the query is the walk; the re-rank is a rounding error by comparison. And almost all of the benchmarked number is the engine itself — the gap between the engine's ~0.64 ms and the benchmark's ~0.9 ms is the serving path around it.
That's worth dwelling on, because the benchmark does not run Infino in-process. Like every engine on those charts, it runs through a server: VectorDBBench sends each query over a loopback connection and reads the results back. The reason Infino wins the chart is that this path is thin — a few hundred microseconds — where a full client-server stack (serialize, network, plan, execute, serialize back) is a couple of milliseconds. When the search itself is ~1 ms, the thickness of that wrapper is the benchmark.
Run Infino embedded — in your process, no socket — and the wrapper disappears, leaving the engine floor: ~0.64 ms for a 1M query at ~0.91 recall, ~2 ms at 0.99. That's the shape to reach for at the small, hot end: an agent that needs memory, a service that needs retrieval, an app that wants a vector index the way it wants SQLite — a library, not a cluster. As the corpus grows past what one box should hold, or when you'd rather not operate the serving tier and its failure modes yourself, the same engine runs as a hosted service — which is where the other shape comes in.
The other shape: object storage at scale
Past some size, holding the whole index resident stops being a decision anyone would make on purpose. The engine's second shape is built for exactly there: the data is served as an IVF-style index on object storage — Infino calls this path OPANN — with vectors stored as Sq16 inside the same immutable Parquet files as the rows. RAM stops being the capacity limit; the limit becomes storage, which is effectively unbounded and ~100× cheaper per gigabyte. This shape is designed for billion-scale corpora — built to carry vectors into the billions, not stop at a few million.
Infino answers a 1M Cohere query (768-dim, top-10) at 0.995 recall@10 with a 5.4 ms p99 once its working set is cached — the same order of magnitude as an in-RAM engine, on storage that costs ~100× less per gigabyte. The first query into a cold cell fetches its index ranges; after that the neighborhood stays warm.
Compare that to the other object-storage-native stores on the same benchmark. S3 Vectors: ~0.87 recall at ~337 ms per query. TurboPuffer, also serving from object storage, lands at ~55 ms. All of them keep their data on object storage, exactly as Infino does — yet Infino answers the same 1M query in single-digit milliseconds at higher recall (the table below). The difference between a third of a second, or even ~55 ms, and a few milliseconds isn't the storage medium; it's what you do with it.
| Object storage · matched k | recall | p99 latency |
|---|---|---|
| Infino — IVF (k=10) | 0.995 | 5.4 ms |
| Infino — IVF (k=30) | 0.998 | 11 ms |
| Infino — IVF (k=100) | 0.997 | 14 ms |
| S3 Vectors (k=30) | 0.872 | 337 ms |
| TurboPuffer (k=100) | 0.899 | 57 ms |
1M Cohere-768 on VectorDBBench, all on object storage. S3 Vectors and TurboPuffer are published standard_20260403 points at their own k (30 / 100), matched by Infino. At matched k, Infino leads on latency (~5× / ~30×) and recall.
The cost of object storage isn't bandwidth, it's round-trips. A GET has latency; a query that fans into many dependent GETs pays that latency over and over. HNSW is the worst case here — each graph hop depends on the last, so a cold walk becomes a serialized chain of range requests. OPANN inverts that: a small routing structure picks the handful of clusters worth reading, and their ranges are known before the data arrives, so they can be issued concurrently, coalesced, and cached.
"Backed by object storage" becomes a cost decision instead of a latency sentence — archive economics with serving latencies that stay usable, at roughly a tenth of the cost of keeping it all in RAM. This is the shape the hosted service is built to run for you: the object-storage tier, the caching, and the calibration, without a cluster to operate.
The mechanism, and the philosophy
None of this is hand-wavy "AI decides." The rule is concrete: the engine serves a query from the resident HNSW graph when one exists for the data being queried, and from the object-storage index (OPANN) when it doesn't — the same path that reads from Parquet at scale. As a working set falls out of the resident cache, queries for it move from the graph to OPANN without a change to your API. And if a graph is missing or evicted for some slice of data, the query falls back to the object-storage path rather than failing — colder, not unavailable. HNSW when it's there, OPANN when it isn't, one mode spanning both.
That's the whole philosophy. A self-driving engine doesn't ask you to tune it; a self-transforming engine doesn't ask you to choose its shape, run two systems, or plan a migration when your hot 100k becomes a cold 100M. It asks for your data and your queries and decides — resident graph or object-storage index, cheap code to navigate or good code to rank, cache this or fetch that — from what's actually in front of it.
The measurements in this post are two ends of one range: under a millisecond in-process for the hot set, ~10 ms off object storage for the vast cold one. The same engine, reshaping itself across the scale, and not making that your problem.
Reproducing it
vectordbbench <engine> --case-type Performance768D1M --k 100 --search-serial

# Infino, resident path, ef sweep to trace the latency-recall curve:
vectordbbench infino --case-type Performance768D1M --k 100 \
--search-mode hnsw_ivf --ef <N> --search-serial - Workload: Cohere-768, Performance cases at 1M and 10M,
k=100, cosine. - Other engines: the published
standard_20260403result set, as of that date. - Hardware: all self-hosted engines on the same 16 vCPU / 64 GB box. Managed-cloud entries run on their provider's own hardware.
- The charts: drawn from our fork of the VectorDBBench dashboard, pending listing on the official board (PR); the latency curves come from the same per-
efresult files behind the throughput view. - Search mode: the Infino run passes
--search-mode hnsw_ivf— a config flag today, and the default in an upcoming release.
One caveat, stated plainly. The single place another engine comes in lower on latency is at 10M above ~0.97 recall, where a managed cloud service edges Infino — measured over a network, on hardware we don't control and whose size isn't disclosed. It's on the chart above. Among engines on the same disclosed box, Infino is the fastest we measured at both scales.
Next in this series: a deeper billion-scale story off object storage, and the quantizer and walk optimizations behind the shapes the engine is self-driving on.